Your cart is currently empty!
Counties with the Most Crimes: Top U.S. Hotspots
Imagine if some counties in the U.S. were hotspots for crime, even more than big cities. Counties with the most crimes are a big worry for police and leaders. They see a lot of car thefts and crimes like rape and burglary. We need to know why these areas have so much crime and how to make them safer.
Key Takeaways
- Property crimes in the U.S. went up by 7%, with a big jump in car thefts at 11%1.
- Baltimore is now the deadliest big city, beating Detroit, with the highest murder and robbery rates1.
- Spokane, Tukwila, Kent, and Tacoma, Washington, are among the top for property crimes1.
- Birmingham, Alabama, has a violent crime rate of 16.94 per 1,000 people, making it very dangerous2.
- Detroit has a violent crime rate of 2,007.8 per 100,000 people, the only city over 500,000 to hit over 2,000 incidents3.
Understanding Crime Rates and Methodologies
Calculating crime rates is key to knowing how safe a place is. We use a standard method: divide the number of crimes by the population, then multiply by 100,0004. But, this method misses unreported crimes, which can change the data a lot5.
Factors Influencing Crime Rates
Many things affect crime rates. Poverty and joblessness are big ones, linked to more crimes5. Young people are often linked to higher crime rates too5. Also, how police record crimes can change the numbers, as some crimes might not be reported5.
Reported vs. Unreported Crimes
Crime stats usually show only what’s reported to police. But, many crimes, especially non-violent ones, aren’t reported5. This means the real crime rate might be higher than what we think, making it hard to fight crime effectively.
| Crime Type | Reported Crimes | Unreported Crimes |
|---|---|---|
| Violent Crimes | 55% | 45% |
| Property Crimes | 42% | 58% |
This table shows how many crimes go unreported, showing why we must look at both sides when studying crime5.
“Reliable crime risk scores are essential for making informed business and safety decisions based on meaningful risk insights.”4
Getting crime rates right is key for fighting crime and keeping people safe. By looking at all crimes, reported and not, we can make better decisions. This helps in using resources well to tackle different community issues54.
Examining the Most Dangerous Counties
Understanding where crime happens is key in fighting crime. Data analysis shows some U.S. counties are hotspots for violent and property crimes. This is a big challenge for police and communities6.
Violent Crime Hotspots
Industry, California, is a hotspot for violent crime, with a rate 10,000% higher than the U.S. average6. In 2017, it saw 73 violent crimes, including 1 murder and 36 robberies6. Anniston, Alabama, had the highest violent crime rate per person, and East St. Louis, Illinois, had the highest murder rate6.
Property Crime Hubs
Property crimes are a big concern too. Even though violent crimes are down, property crimes are up7. Chicago had the most murders, Los Angeles had the most rapes, and New York City had the most robberies and assaults6. Baltimore is the most dangerous big city, with crime rates over 200% of the national average6.
| Metric | Top Ranking City |
|---|---|
| Highest Murder Rate | East St. Louis, Illinois |
| Highest Number of Murders | Chicago |
| Highest Number of Rapes | Los Angeles |
| Highest Number of Robberies | New York City |
| Highest Number of Aggravated Assaults | New York City |
The data shows we need better crime prevention and community support7. Looking into why these crimes happen, we see we need a complex plan to make our country safer7.
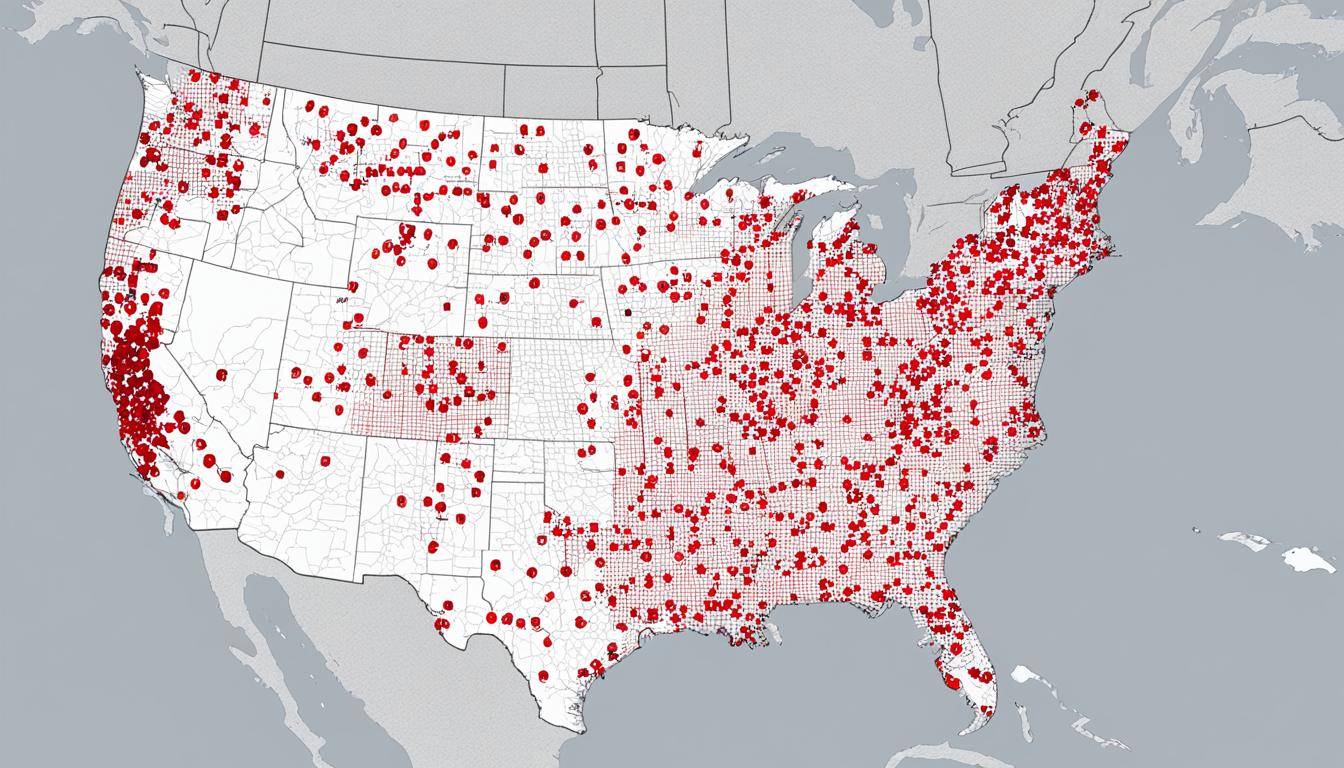
Counties with the most Crimes: A National Overview
A deep dive into crime rates across the U.S. shows where most crimes happen. This analysis highlights how crime spreads out geographically8. Now, 58% of Americans want to see crime go down, up from 47% when Joe Biden took office in 20218.
In 2022, the FBI found that the U.S. saw 1,954.4 property crimes and 380.7 violent crimes per 100,000 people8. Most property crimes were theft, vehicle theft, and burglary. Violent crimes were mostly aggravated assault, with some robbery, rape, and murder8.
| State | Violent Crime Rate (per 100,000) | Property Crime Rate (per 100,000) |
|---|---|---|
| District of Columbia | 812.3 | 2,847.4 |
| New Mexico | 780.5 | 3,284.7 |
| Alaska | 758.9 | 2,905.1 |
| Arkansas | 645.3 | 2,583.8 |
| Louisiana | 628.6 | 2,673.2 |
The top crime spots include the District of Columbia, New Mexico, Alaska, Arkansas, and Louisiana, with high violent crime rates9. Tennessee, California, Colorado, South Carolina, and Missouri are also hotspots9.
The violent crime rate has changed over time, from 383.4 in 2018 to 380.7 in 20229. This shows we need to understand what drives crime better.
Crime rates have dropped a lot since 1993, by 49% for violent and 59% for property crimes8. But the Bureau of Justice Statistics says the drop is even bigger, 71% for both types of crime8.
“The big changes in crime rates and the differences in data show how complex crime is. We need a detailed, data-based approach to tackle these issues.”
Policymakers and law enforcement are facing big challenges with crime. This national look can help them make better decisions and improve safety10.
Socioeconomic Factors and Crime Rates
The link between socioeconomic factors and crime rates is clear11. Theories like strain theory, social disorganization theory, and economic deprivation theory explain how poverty, unemployment, and inequality lead to more crime11.
Poverty, Unemployment, and Crime
Being unemployed can cause financial stress and limit access to resources, making people more likely to turn to crime11. Poverty often means people may steal, deal drugs, or commit property crimes11. Family issues also play a part, with unstable families raising the risk of criminal behavior11.
Studies show that many criminals are jobless or work in low-paying jobs, linking poverty to crime12. In cities and among those earning less than $30,000, the risk of being a victim or a criminal is higher12.
Improving education, offering equal chances, and supporting vocational training can lower crime rates by helping people11. Fixing issues like healthcare, mental health, drug treatment, jobs, and community programs is key to safer, more united societies and less crime11.
| Socioeconomic Factor | Impact on Crime Rates |
|---|---|
| Poverty | Increases likelihood of engaging in illegal activities like theft, drug trafficking, and property crimes11 |
| Unemployment | Leads to financial strain, reduced access to resources, and increased susceptibility to criminal activities11 |
| Family Structure | Unstable or dysfunctional family environments contribute to higher chances of engaging in criminal behavior11 |
| Educational Opportunities | Investing in educational resources and vocational training can help reduce crime rates by empowering individuals11 |
| Community Resources | Access to healthcare, mental health services, substance abuse treatment, employment opportunities, and community development programs can address underlying socioeconomic factors contributing to criminal behavior11 |
“Reducing poverty, promoting employment opportunities, addressing educational disparities, strengthening family structures, and enhancing community resources are vital in creating safer, more inclusive societies and reducing crime rates.”11
Law Enforcement Strategies and Community Policing
High crime rates in some counties have led law enforcement to try new strategies. Community policing is one approach, focusing on police and community working together13. In the 1990s, the best ways to fight crime were often about prevention. This included better healthcare, less cash around, and cleaning up the environment13.
Community policing has shown it can lower crime and make people feel safer. For instance, Camden, New Jersey, saw a 52% drop in violent crime from 2012 to 2020 with this method14. Camden’s police also cleared more homicide cases, reaching a 96% rate14.
Police have also tried other ways to prevent crime. These include being proactive, focusing on specific areas, and using more resources to solve crimes15. These methods have helped reduce gun violence and solve more shootings15.
But, how well these strategies work depends on trust between police and the community15. Building trust takes time and involves all police officers to work better with the community15.
Training young people in social and emotional skills has also cut crime rates13. Also, having more non-profits in a city can lead to less violence, showing the link between community groups and safety13.
These new ways of fighting crime show the need for a broad approach. It should tackle the reasons behind crime, build strong police-community ties, and help those at risk131514.
“Small investments in humanity in jail and prison settings yield significant returns when institutions are designed to focus on rehabilitation rather than solely punishment.”
The Impact of Organized Crime and Gang Activity
Organized crime and gang activity greatly affect crime rates in the U.S. Criminal groups, like drug traffickers and gangs, play a big role in violent and property crimes in high-crime areas16. Over the last ten years, there were about 27,000 gangs on average each year. The latest count shows over 30,000 gangs, which is 15 percent more than in 2006 and the most since 199616.
Drug Trafficking and Criminal Networks
Organized crime goes beyond local areas. Drug trafficking is a big business for these groups, making a lot of money17. In 2009, it was thought to make $870 billion, or 1.5% of the world’s GDP, with drug trafficking alone worth $320 billion17. These crimes harm communities, cause violence, and keep the cycle of crime going.
Stopping drug trafficking and breaking up criminal networks is key to fighting crime. By hitting at their money and structure, we can lessen organized crime and gang activity’s effect on communities.
“Organized crime and gang activity have a far-reaching impact on our communities, fueling violence, drug abuse, and economic instability. Addressing these complex issues requires a comprehensive, multi-faceted approach that targets the underlying drivers of criminal behavior.”
Urban vs. Rural Crime Patterns
Crime rates and the types of crimes differ a lot between cities and countryside. Cities often see more violent crimes, while rural areas have more property crimes1819. This shows the different challenges and factors that affect crime in these areas.
In 2021, cities had a violent crime rate of 24.5 per 1,000 people aged 12 or older. This was much higher than the 11.1 rate in rural areas18. Cities also saw a property crime rate of 157.5 per 1,000 people, way above the 57.7 rate in rural areas18. But, rural areas aren’t safe either, facing threats from burglary and theft19.
Crime types vary between cities and countryside. For example, cities made up 40% of all rape and sexual assault cases in 2015. Victims in cities were also 48% of all robbery targets that year20. Rural areas, on the other hand, saw more gun suicides and were hit hard by the opioid crisis19.
Reporting crimes to the police is also different in urban and rural areas. Cities tend to report more crimes20. This affects how we understand crime and how resources are used to meet community needs.
It’s key to understand and address crime patterns in both urban and rural areas. This helps in making safer communities and improving well-being182019.
“Serious violent victimizations in urban areas decreased by 74% from 1995 to 2015, while rural areas saw a 67% decrease over the same time period.”20
Crime Prevention and Public Safety Initiatives
To tackle high crime rates in the U.S., many crime prevention and public safety efforts have been started21. These efforts aim to cut crime, boost community health, and make places safer for everyone. Key programs like neighborhood watch and youth intervention are leading the way.
Neighborhood Watch Programs
Neighborhood watch programs are a strong tool against crime21. They get residents to watch out, report odd stuff, and work with police to stop threats. This teamwork makes communities safer and stops crime.
Youth Intervention Programs
Youth intervention programs are vital for stopping crime before it starts21. They help young people who are at risk with education, fun activities, and mentors. This helps them choose better paths and grow into positive adults.
Starting these programs isn’t easy, though21. Money issues, how resources are used, and trust in the community can slow them down. But, working together, we can make a big difference in crime rates and life quality.
| Initiative | Key Objectives | Outcomes |
|---|---|---|
| Neighborhood Watch Programs |
|
|
| Youth Intervention Programs |
|
|
By using a mix of community programs, youth help, and teamwork, we can really cut crime and boost safety. These efforts are key to making our communities safer and more lively2223
The Role of Technology in Crime Mapping and Analysis
Technology has changed how police fight crime. Now, they use crime mapping, data analytics, and predictive policing to find hotspots and plan better. This helps them tackle crime in areas with the most issues24.
The National Institute of Justice (NIJ) funds projects to improve these methods. For example, a study showed that a small number of places in Minneapolis had a lot of police calls. This shows where crime is concentrated24.
RAND looked into Shreveport’s predictive policing and found it improved analysts’ skills. They could spot patterns better and get timely data24. NIJ also funded a study that showed how to predict where crime might happen by looking at the environment24.
| Technology in Law Enforcement | Adoption Rate |
|---|---|
| Departments with Computerized Crime Mapping | 36% for large departments, 3% for smaller departments25 |
| Departments with Customized Mapping Applications | 38%25 |
| Departments Using Automated Pin Maps | 72%25 |
| Departments Conducting Hot Spot Analyses | 77%25 |
Technology has made a big difference in crime mapping and data-driven crime prevention. As more agencies use these tools, they can spot trends, predict crimes, and use resources better. This makes everyone safer2425.

But, we must be careful with these technologies. We need to make sure they don’t unfairly target certain groups. It’s important to keep studying and improving predictive policing to avoid biases24.
“The key is to leverage technology in a way that enhances community-oriented policing and promotes fairness and transparency in law enforcement.”
As crime mapping and data analytics get better, using technology can lead to smarter crime fighting. This can make our communities safer and happier2425.
Regional and State-level Crime Statistics
This article focuses on counties with the most crimes but also looks at regional and state-level crime trends. It gives an overview of crime data and statistics at these levels. This helps readers see how some areas have much higher crime rates than others or the national average.
Nationwide, the violent crime rate in 2022 was 380.7 per 100,000 people. This includes homicide, rape, robbery, and aggravated assault rates. The property crime rate was 1,954.4 per 100,000, with burglary, motor vehicle theft, and arson rates.
At the state level, New Mexico had the highest violent crime rate at 780.5 incidents per 100,000 people. Maine had the lowest violent crime rate at 103.3 occurrences per 100,000. Washington had the highest property crime rate at 3,356.4 crimes per 100,000 people, while Idaho had the lowest at 926.9 incidents per 100,000.
The Northeastern states had the lowest crime rates, with property crime 27.6% lower and violent crime 23.0% lower than the rest of the country. The national crime rate has dropped by 58.0% since 1979, with a 61.0% drop in property crime and a 30.6% drop in violent crime.
Interestingly, red states have had a higher homicide rate than blue states since the start of the century26. But, factors like race, age, gender, urbanization, and income are key to understanding this. These factors make the Trump vote insignificant in predicting homicides at the county or state level.
This section gives a detailed look at27 regional and27 state-level27 crime statistics. It shows the10 geographic crime patterns and27 crime rate comparisons across the US. Understanding these trends helps readers put county-level data into context, giving a full view of the27 crime situation in the country.
Comparing Crime Rates Across the United States
To understand the crime problem better, we need to look at crime rates compared to the national average. This gives us a clear view of where crime is most common in the U.S.
Most Dangerous Cities and States
The U.S. crime rate is 47.7028. Some cities and states have much higher rates. Cities like Baltimore, Detroit, and Memphis have the highest murder rates1. For property crimes, San Francisco, Portland, and Seattle are at the top1.
In medium-sized cities, New Orleans and St. Louis have the highest murder rates1. Oakland is the leader in property crimes among these cities1. Small cities like Salt Lake City and Birmingham have the highest rates for rape and murder1. For property crimes, Salt Lake City and Tacoma are at the top for larceny-theft and motor vehicle theft, respectively1.
| Crime Metric | Highest Ranking Large City | Highest Ranking Medium City | Highest Ranking Small City |
|---|---|---|---|
| Murder Rate | Baltimore | New Orleans | Birmingham |
| Property Crime Rate | San Francisco, Portland, Seattle | Oakland | Tacoma (motor vehicle theft), Salt Lake City (larceny-theft) |
| Rape Rate | N/A | N/A | Salt Lake City |
Some countries have much higher crime rates than the U.S. For example, Venezuela has a crime index of 83.76, and Papua New Guinea is at 80.7928. South Africa, Afghanistan, and Honduras also have very high crime rates28.
Crime is a complex issue with big differences across the U.S. and the world. Knowing where crime is most common helps us make better crime prevention and law enforcement plans281.
International Perspectives on Crime and Safety
Looking at the world beyond the U.S., we see how different countries handle crime rates, crime trends, and crime prevention. This section will look at how various nations deal with high-crime areas and their prevention efforts29.
The Gallup World Poll (GWP) surveys over 160 countries yearly since 2006. It asks about theft and violence experiences29. Researchers use this data to spot trends in theft and violence levels from 2006-2009 to 2015-2019, and all the way to 201929.
The International Crime Victim Survey (ICVS) started in the 1990s. It gathers self-reported crime data across many countries29. With over 350,000 citizens surveyed in thirty languages, it gives us a global look at crime prevention and safety issues29.
Studies show that poverty, joblessness, inequality, city growth, community ties, and government quality affect crime rates29. Economic struggles, lack of opportunities, and feeling unfairly treated also push people towards crime29.
The International Centre for the Prevention of Crime (ICPC) leads in comparing crime prevention methods30. Their work covers school safety, women’s safety, and home burglary30. ICPC’s reports in English, French, and Spanish help us understand global crime prevention better30.
The United Nations Survey of Crime Trends and International Criminal Police Organization (Interpol) give us insights into crime rates worldwide31. These sources show us the global crime trends and efforts to fight them31.
The Future of Crime Prevention and Enforcement
The world of crime and safety is always changing. We need to think about how we prevent crime and enforce laws in the future. New trends and challenges show us the need for new ways to use technology, reform justice, and work with communities for a safer future.
Emerging Trends and Challenges
Technology is playing a bigger role in crime prevention. New tools like data analytics and surveillance systems help police find and stop crime32. But, we must think about the right way to use these tools to protect everyone’s privacy and rights.
Working on criminal justice reform is also key for the future. We’re trying to lower crime rates by tackling issues like poverty and mental health32. The goal is to make justice more about helping people and less about just punishing them.
Getting communities involved with police is becoming more important for fighting crime33. Programs like neighborhood watches and helping young people can make areas safer32. Working together, we can tackle the specific problems of different areas.
Looking ahead, we need a mix of technology, justice reform, and community work for a safer, fairer society3233.
“The future of crime prevention lies in the intersection of technology, policy reform, and community engagement. By embracing this multifaceted approach, we can build a more resilient and just society.”
Conclusion
This detailed look has shown us the top counties with the most crime in the U.S. We’ve seen how complex issues lead to these high crime rates. From Venezuela’s high crime index34 to South Africa and Honduras’s high murder rates34, the numbers are shocking. They show the big safety problems many communities face.
But, we’ve also seen the power of using data and working together to fight crime. By tackling issues like poverty and joblessness34, we can start to make things better. This means safer streets and better lives for everyone.
This article is a key tool for those wanting to make a change. It talks about crime prevention strategies, improving public safety, and addressing high-crime areas. By summarizing the key points, we see how important it is to work together. We need to use data and join forces to make our communities safer and stronger.
FAQ
What is the overall crime rate in the United States?
The overall crime rate in the United States is 47.70 per 100,000 people. Crime rates vary a lot between states. Some states have much higher crime rates than others.
How are crime rates typically calculated?
Crime rates are figured out by dividing the total number of reported crimes by the total population. Then, you multiply the result by 100,000. But, this method doesn’t count unreported crimes.
What factors can influence a region’s crime rate?
Poverty, unemployment, and age can greatly affect a region’s crime rate. Also, how crimes are reported and classified by police can change the data. Many crimes aren’t reported to the police.
Which counties in the United States have the highest rates of violent and property crimes?
We’ll look at the counties with the highest violent and property crime rates in the United States. We’ll see which crimes are most common in these areas.
How do socioeconomic factors contribute to high crime rates in certain counties?
Poverty, unemployment, and other economic issues are linked to high crime rates. We’ll look into how these factors affect crime rates in some counties.
What strategies have law enforcement agencies developed to address high crime rates in certain counties?
Law enforcement has come up with strategies like community policing and crime prevention programs. These are to tackle high crime rates and improve safety.
How does organized crime and gang activity impact crime rates in high-crime counties?
Organized crime and gangs play a big role in crime rates in many counties. We’ll see how dealing with these groups can help reduce crime in these areas.
How do crime patterns differ between urban and rural counties?
Crime rates and types vary a lot between cities and countryside. We’ll compare crime patterns in cities and rural areas. We’ll look at what makes crime rates different in each place.
What crime prevention and public safety initiatives have been implemented to address high crime rates in certain counties?
To fight high crime rates, initiatives like neighborhood watches and helping youth have been started. We’ll check how well these efforts work in reducing crime and making communities safer.
How have advancements in technology impacted the way law enforcement agencies approach crime prevention and analysis?
New tech like crime mapping and data analysis has changed how police fight crime. It helps them spot crime hotspots and plan better strategies.
How do the crime rates in the counties with the most crimes compare to the national average and other parts of the country?
We’ll compare crime rates in high-crime counties to the national average and other areas. This gives us a better idea of where crime is most common in the U.S.
How do the crime rates and public safety challenges faced by the United States compare to other countries?
Looking at crime rates and safety in the U.S. is interesting when compared to other countries. We’ll see how different countries handle crime and safety issues.
What are the emerging trends and innovative approaches that may shape the future of crime prevention and law enforcement?
Crime and safety are always changing. We’ll look at new trends and ideas that could change how we fight crime. This includes tech, justice reforms, and community efforts.
Source Links
- 2024 Crime Rates in U.S. Cities Report – https://www.safehome.org/resources/crime-statistics-by-state/
- 17 Most Dangerous Cities in America You Should Know About for 2024 – Freedom For All Americans – https://freedomforallamericans.org/most-dangerous-cities-in-america/
- Top 10 Most Dangerous Cities in the US 2024 [Latest Rankings] – https://www.geeksforgeeks.org/most-dangerous-cities-in-us/
- What Is the Most Accurate Measure of Crime? – https://pinkerton.com/our-insights/blog/what-is-the-most-accurate-measure-of-crime
- Myths and Realities: Understanding Recent Trends in Violent Crime – https://www.brennancenter.org/our-work/research-reports/myths-and-realities-understanding-recent-trends-violent-crime
- Which U.S. Cities Are the Most Dangerous? | Security.org – https://www.security.org/resources/most-dangerous-cities/
- States With The Worst Crime Rates – https://www.forbes.com/advisor/legal/criminal-defense/crime-rate-by-state/
- What the data says about crime in the U.S. – https://www.pewresearch.org/short-reads/2024/04/24/what-the-data-says-about-crime-in-the-us/
- List of U.S. states and territories by violent crime rate – https://en.wikipedia.org/wiki/List_of_U.S._states_and_territories_by_violent_crime_rate
- Which states have the highest and lowest crime rates? – https://usafacts.org/articles/which-states-have-the-least-and-most-crime/
- The impact of socioeconomic factors on crime rates. – https://www.alliedacademies.org/articles/the-impact-of-socioeconomic-factors-on-crime-rates-26135.html
- Social and Geographic Aspects of Crime: A Review of Theory and Literature – https://www.justice.gc.ca/eng/rp-pr/csj-sjc/crime/rr06_6/p2.html
- Vital City | 20 Strategies for Reducing Crime in Cities – https://www.vitalcitynyc.org/articles/twenty-strategies-for-reducing-crime-in-cities
- 5 Reasons Why Community Policing is Effective – https://www.lesniakinstitute.org/5-reasons-why-community-policing-is-effective/
- Law enforcement strategies to reduce violence – https://www.police1.com/chiefs-sheriffs/articles/law-enforcement-strategies-to-reduce-violence-wItHuxvLO0IHLEEk/
- National Youth Gang Survey Analysis: Measuring the Extent of Gang Problems – https://nationalgangcenter.ojp.gov/survey-analysis/measuring-the-extent-of-gang-problems
- Transnational organized crime: the globalized illegal economy – https://www.unodc.org/toc/en/crimes/organized-crime.html
- Where are crime victimization rates higher: urban or rural areas? – https://usafacts.org/articles/where-are-crime-victimization-rates-higher-urban-rural-areas/
- The Hidden Truth About Rural Crime Rates – https://www.deepsentinel.com/blogs/farming/the-hidden-truth-about-rural-crime-rates/
- 2018 NCVRW Resource Guide: Urban and Rural Victimization Fact Sheet – https://ovc.ojp.gov/sites/g/files/xyckuh226/files/ncvrw2018/info_flyers/fact_sheets/2018NCVRW_UrbanRural_508_QC.pdf
- A Look at Program Performance, Part 3 – https://lao.ca.gov/1998/0598_california_counties/0598_california_counties_part_3.html
- Public Safety Realignment: Impacts So Far – https://www.ppic.org/publication/public-safety-realignment-impacts-so-far/
- Crime and Safety in America – The Policy Circle – https://www.thepolicycircle.org/brief/crime-and-safety-in-america/
- From Crime Mapping to Crime Forecasting: The Evolution of Place-Based Policing – https://nij.ojp.gov/topics/articles/crime-mapping-crime-forecasting-evolution-place-based-policing
- The Use of Computerized Crime Mapping by Law Enforcement: Survey Results (Research Preview) – https://www.ojp.gov/pdffiles1/fs000237.pdf
- The “Red” vs. “Blue” Crime Debate and the Limits of Empirical Social Science – https://manhattan.institute/article/red-vs-blue-crime-debate-and-the-limits-of-empirical-social-science
- Crime in the United States – https://en.wikipedia.org/wiki/Crime_in_the_United_States
- Crime Rate by Country 2024 – https://worldpopulationreview.com/country-rankings/crime-rate-by-country
- Global Crime Patterns: An Analysis of Survey Data from 166 Countries Around the World, 2006–2019 – Journal of Quantitative Criminology – https://link.springer.com/article/10.1007/s10940-021-09501-0
- Untitled-7 – https://cipc-icpc.org/wp-content/uploads/2019/08/International_Report_on_Crime_Prevention_and_Community_Safety_ANG.pdf
- 03-88041_E_pr.qxd – https://www.unodc.org/pdf/crime/forum/forum3_Art2.pdf
- 5 Ways States Can Reduce Violent Crime – Tools for States to Address Crime – https://projects.csgjusticecenter.org/tools-for-states-to-address-crime/5-ways-states-can-reduce-violent-crime/
- Preventing Crime: What Works, What Doesn’t, What’s Promising – https://www.ojp.gov/pdffiles/171676.pdf
- Top 10 Countries with the Highest Crime Rate – GeeksforGeeks – https://www.geeksforgeeks.org/countries-with-highest-crime-rate/